
Lygia: Bridging the Gap Between the Public and the Access to Museums and Art Galleries
This is a Study Case focused on enhancing the accessibility of museums and art galleries in Porto Alegre (Rio Grande do Sul, Brazil) to the public through a digital platform.
🏭 Industry: Art/Museum
📱 Application Format: Mobile
⌛️ Time Frame: June 2021 - Present
👩🏼💻 Roles: UX Researcher, UX Designer, UI Designer, UX Writer
Tailored Insights: Navigating Project Engagement for Busy Readers
Recognizing the busy nature of the reader, two distinct pathways are offered:
The project in a nutshell provides a quick, high-level overview tailored for efficiency.
The project in depth caters to those with a bit more time and curiosity, offering a detailed exploration.
1. This project in a nutshell
For methodology, I used an adaptation of the Double Diamond, a structured design approach to try to solve challenges in four phases: Discover, Define, Develop and Deliver.
Unlocking the Mystery:
Why people don't visit museums? 🤔
Imagine a world where a silent pandemic closed museum doors, leaving art lovers culturally starved. My initial assumptions suggested the closure exacerbated the issue, however, a shift in focus during desk research revealed that most Brazilians didn't visit museums even before the pandemic (96%).
After a research, I found out why.
Tools:
Exploratory Research
Quantitative Research
Qualitative Research
Accessibility
Museums can be visited only in Business Hours
Location
People who lives in remote areas can't have access to museums that are far away
Education
Contextualization of the work of art is missed
Inclusion
People don't feel like they belong to Museum enviroment
2. This project in depth
For methodology, I used an adaptation of the Double Diamond, which is like a map guiding us through the complexity of problem-solving, breaking it down into four phases – Discover, Define, Develop, and Deliver – to ensure a thorough and structured approach.
Discover: Diverge into the problem
Unlocking the Mystery:
Why people don't visit museums? 🤔
Tools:
Exploratory Research
Quantitative Research
Qualitative Research
The Silent Exodus: Museums in the Time of Pandemic
Imagine a world where a silent pandemic swept through the streets, forcing the doors of museums to close one by one. Museums, once vibrant sanctuaries of art, were shrouded in silence, their doors firmly closed. The streets were devoid of excited footsteps, and the galleries echoed only with the memories of visitors.
Art lovers, once nourished by the brushstrokes and sculptures of great masters, were left in a state of cultural starvation. In this pandemic scenario, the absence of the cultural havens left a void in their souls, a void only art could fill.
To better understand this problem, I started with a Desk Research to collect relevant data about the habits and behaviours between Brazilian people and Museums.
96%
of Brazilians do not go to Museums*
93%
of Brazilians have never visited an Art Exhibition*
*Source: Brazilian Museum Guide

Challenging Assumptions: Surprises and Adjustments 💔
What I discovered? Most Brazilians didn't even go to museums when they were open. Actually, museums closed due to the pandemic weren't a problem because people weren't visiting them anyway.
Understanding Why 96% of Brazilians Avoid Museums
As I was full of doubts, so I decided that the next steps would be qualitative and quantitative research.
In qualitative research I can obtain demographic data and have a greater reach of people to answer the questionnaire. As the only prerequisite for the target audience is to be Brazilian, it is possible to publicize the form and obtain relevant data from a variety of people.
For the qualitative, I chose the online interview method and focused on people who aligned with the age and gender data obtained in the quantitative research.
Quantitative Insights from 49 Participants
For quantitative research, I used the Google Forms platform. I developed a questionnaire with 17 questions (including an optional one), focusing on demographic data, number of visits to museums, experiences experienced in museums or exhibitions; reasons for visiting or not visiting an exhibition and ticket prices. The average time to answer the form was 3 minutes.
About the public who answered the form:
51.8%
Women
48.2%
Men
39.5%
Ages between 21 and 30
37.5%
Ages over 35
23.3%
Ages between 31 and 35
When asked if they visited museums before pandemic:
57.1%
Yes
42.9%
No
Of those who answered yes, the frequency with which they visited was:
71.9%
Once a year
28.1%
Once a month
About problems that make harder to visit museums:
89%
mentioned the fact that Museums are open in Business Hours, making harder to make visits in person
93.3%
mentioned that they feel like they not belong to the Museum enviroment
Qualitative Research
I carried out qualitative research through interviews with three different people: Gabriela (30 yo), Wagner (32yo) and Carine (58yo). The interviews were done online, via video calls.
I addressed issues such as virtual visits and their positive points; experiences and feelings already experienced in museums or exhibitions; reasons for visiting or not visiting an exhibition; interest in art; ticket prices and the importance of contextualizing the works of art.

Tips for qualitative research 💡
This qualitative research was the first I carried out as a UX Designer. So I leave you with some tips that I wish I knew before: talk about the user life instead of your idea & ask about specifics in the past instead of generics or opinions about the future. More tips are in my article "The Mom Test - Book Summary", available here.
So, why 96% of Brazilians didn't go to museums?
Some insights I got after the interview:
Time Restriction
Museums can be visited only in Business Hours
Location
People who lives in remote areas can't have access to museums that are far away
Education
Contextualization of the work of art is missed
Inclusion
People don't feel like they belong to Museum enviroment
Define: Converge in the area of focus
Bridging the Access Gap:
How to make museums accessible?
Tools:
Benchmark
Personas
User Statements
The magic started to happen...✨
Dealing with the challenges of the pandemic, many people are finding it tough to enjoy museums. The problems are limited opening hours, museums being far away in big cities, and a feeling of not fitting in. The solution that addresses all these concerns is virtual visits. In this phase, I will explore how to implement virtual visits in a manner that provides people with access to art and museums, effectively resolving the challenges they currently encounter.
Similar Solutions
Benchmark research is important during the definition because is the part of immersion that we use to better understand the possibilities of our product based on products that already offer similar solutions.
23 museums of 1118 offer virtual visits
Virtual tour services already offered in Brazil:
Google Arts & Culture: It's a non-profit project, developed by the Google Cultural Institute. The project uses Street View technology captured in high definition (ArtCamera).
It showcases cultural collections, works of art and historical documents that are available in physical museums around the world. The Museums that participate in the project: National Historical Museum, National Museum of Fine Arts, Lasar Segall Museum, Imperial Museum, Castro Maya Museum and Villa-Lobos Museum.
The museums that have virtual tours in Porto Alegre:
Farol Santander (Private)
Fundação Iberê Camargo (Private)
Museu da História da Medicina (Non-profit)
Museu de Ciência e Tecnologia da PUCRS (Non-profit)
Personas
To create personas, I used the data obtained in the discovery phase about the context of qualitative research users:
51.8% of the audience is female and 48.2% male, with predominant ages between 21 and 30 years old (39.3%), over 35 years old (37.5%) and between 31 and 35 (23.2% ). The predominant monthly income is between R$1500 and R$3000 (39.6%), followed by above R$6000 (18.9%).
I defined a total of three personas for this project and segmented the information into three distinct groups, so that the personas are, in fact, a reflection of the data obtained in the research.
User Statements
Ok, the virtual exhibition seems like a possible solution, but why? That are some points that user statements (based on the Personas) are going to help us to better understand.
Marilia
Needs to access art without leaving home, so she can know more about art without go to the museum in person.
Talita
Needs to access exhibitions without leaving home so she doesn't need to move far from home.
Regis
Needs to feel more like he belongs to the museum so it will encourage him to consume art.
Develop: Diverge in potencial solutions
Bridging the Access Gap:
Developing an Immersive Virtual Museum Experience
Tools:
Wireframing
Sitemap
MVP Features
I used Card Sorting to prioritize features based on the insights obtained in qualitative research and separated them into the main categories: Accessibility, Location, Education and Personalization.
Accessibility
Intuitive Navigation: Provide a user-friendly interface with clear navigation options, allowing visitors to easily explore different exhibits and move between different areas of the virtual museum.
Location
Virtual Tour Guide: People can use technology to experience exhibitions with ease, 24 hours a day.
Education
Context of artworks and artists: Offer a virtual tour guide feature that provides informative commentary and explanations about the exhibits, replicating the experience of having a knowledgeable guide leading visitors through the museum.
Interactive Exhibits: Include interactive elements within the virtual exhibits, such as clickable objects and photos to engage users and enhance their learning experience.
Personalization/Inclusion
Customizable Experience: Allow users to personalize their virtual museum visit by choosing their preferred route, artists and exhibition catering to individual interests and preferences.
Map: The user will have the option to navigate a map to see the nearest museums based on location.
Future Features
Accessibility
Accessibility Options: Ensure that the virtual museum is accessible to a wide range of users by offering features such as adjustable font sizes, alternative text for images, captioning for audio and video content, and compatibility with assistive technologies.
Multi-platform Compatibility: Develop the virtual museum to be accessible across different devices and platforms, including desktops, laptops, tablets, and mobile devices, ensuring a consistent user experience regardless of the device used.
Multi-language Support: Provide options for users to access the virtual museum in different languages, catering to a diverse global audience and facilitating international participation.
Location
Offline Access: Consider providing an option for users to download certain exhibits or content for offline access, allowing them to revisit and enjoy the museum even without an internet connection.
Virtual Reality (VR) Integration: Consider integrating virtual reality technology to provide an immersive experience for users, allowing them to feel as if they are physically present in the museum, interacting with the exhibits in a more realistic and engaging manner.
Education
Filter: Implement a filter functionality to provide filtering options to sort exhibits based on various criteria such as time period, art style, or artist.
Personalization
Feedback and Rating System: Implement a feedback and rating system that allows users to provide their opinions, suggestions, and ratings on exhibits, helping to improve the overall experience and future enhancements.
Sitemap
A sitemap is a list of all the important pages on a website/mobile application. It is an essential part of the development process. Today I see that one of the main mistakes I made was going straight to Figma to test ideas before I even had them. 😅
In this project, virtual visits will be divided into 4 categories: artists, works of art, exhibitions and museums. Each of them will be connected to the other during navigation.
Wireframing
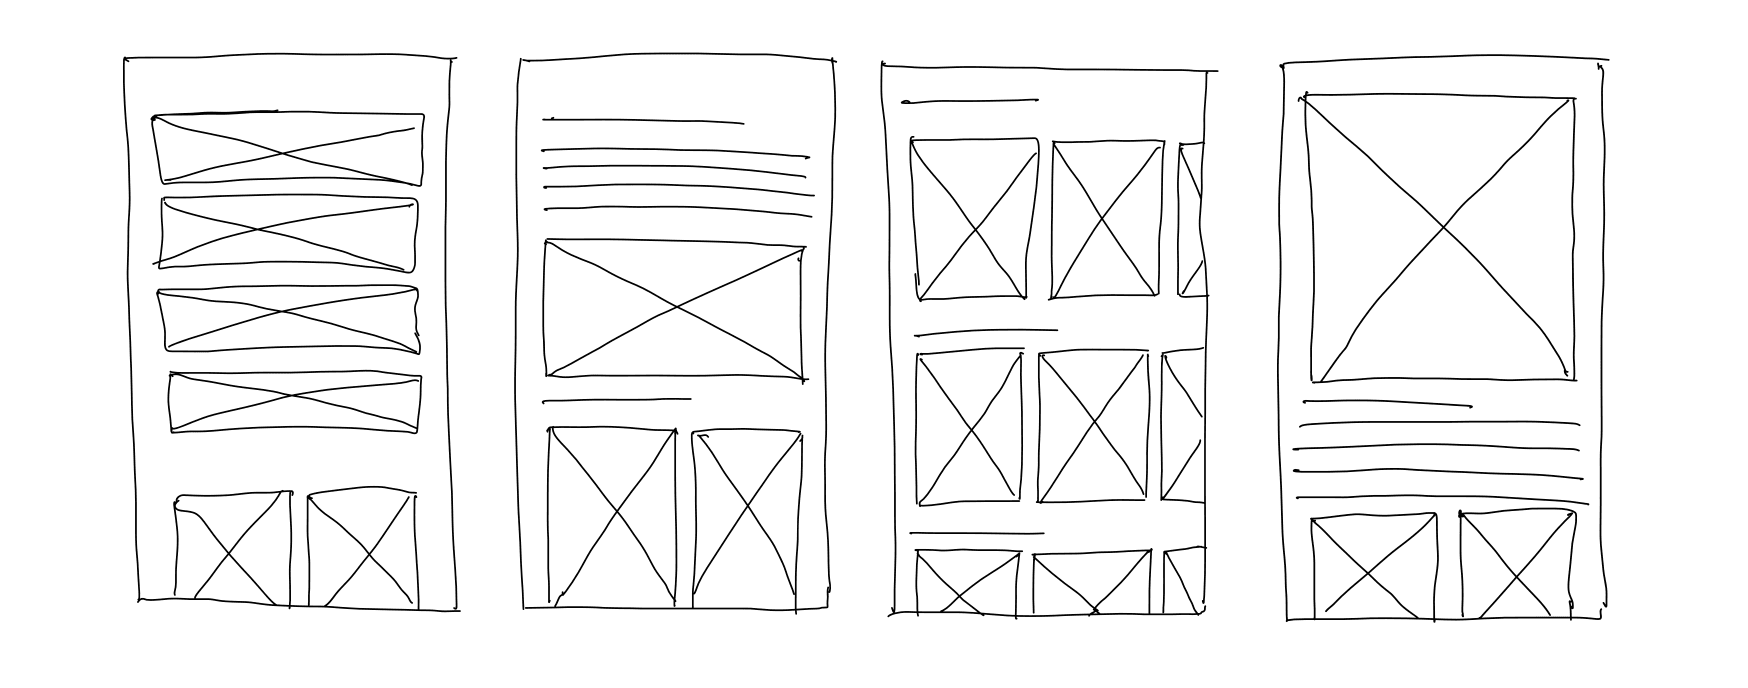
I used to just jump into solutions without thinking of ideas first. I've learned to take it slow, respect the design process, and focus on organizing ideas with simple sketches and prototypes using pen and paper. It helps me make quick corrections and be more creative.
“In the digital age, don't forget to use your digits! Your hands are the original devices. Use them.” Lynda Barry
Visual Design
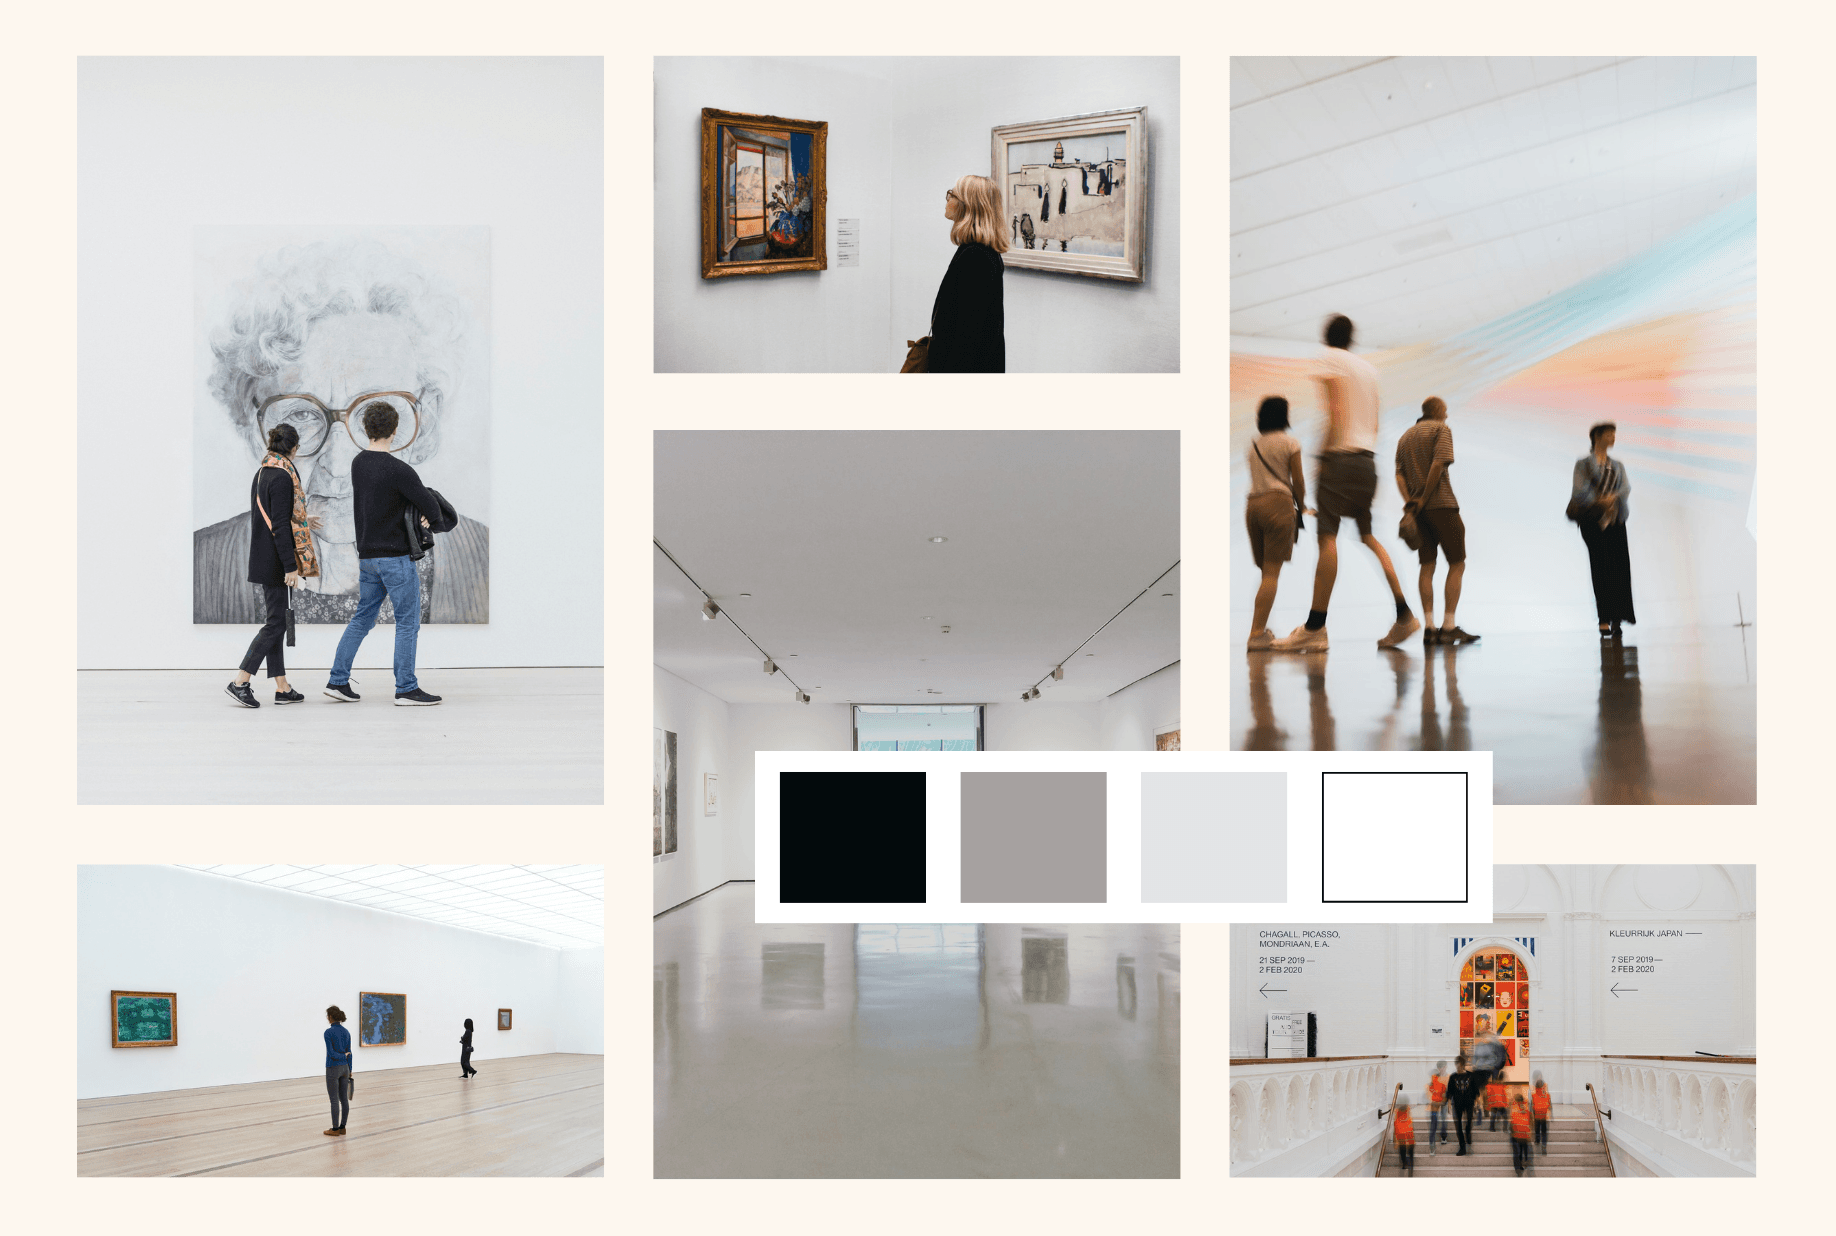
Imagine Lygia as your guide in the art world. When creating its look, I went for simple and calm colors, making sure the focus stays on the amazing art. The colors are like timeless classics – gray, black, and white – this monochromatic harmony ensures that your focus remains on the artwork and exhibits, making your exploration an experience of pure visual delight.
For the words you read, I picked Alata and Roboto fonts. They're modern, flexible, and easy to read, making sure your message not only shows up but is also crystal clear.
And why "Lygia"? It's a nod to Lygia Martins Costa, the first Brazilian Museologist, giving a touch of history to this art experience.
Deliver: Converge in solutions that work
Resolving the Challenge:
Lygia - Your Online Art Experience
This project aims to find a solution to bridge the gap between the public and the access to Museums and Art Galleries by designing and evaluating a virtual museum visit experience.
Tools:
High Fidelity Prototype

Defining and Measuring Success 🎉
Now that we've figured out how to fix the problem, it's crucial to plan how we'll know if it's working well. I've split the solutions into four parts, each fixing a different problem. And to make sure they work, I've found the best ways to check how well they're doing.
Accessibility
✅ Elderly people, people with limited mobility, or people living with disability can use technology to experience exhibitions with ease, 24 hours a day.
📊 How to measure: Collect and analyze demographic information of users (age, sex, location, mobility status, and disability type.)
Location
✅ One of the most significant benefits of virtual museums is that your time and location do not constrain you.
📊 How to measure: Collect and analyze demographic information of users (location) and Usage Metrics: Track the time of users accessing the technology and monitor the frequency and duration of usage.
Inclusion
✅ Many museums have found that digitalization increases website traffic and brings more visitors to the museums themselves.
📊 How to measure: measure whether the number of in-person visitors has increased.
Education
✅ Showcasing Masterpieces and lesser-known pieces of art in these museums with additional context, history, and techniques has piqued people’s curiosity and inspired them to one-day visit locations in person.
📊 How to measure: Measure the level of user engagement with the content. Track interactions, such as clicks, views, and exploration within the exhibition. Analyze the average time users spend exploring the exhibition.
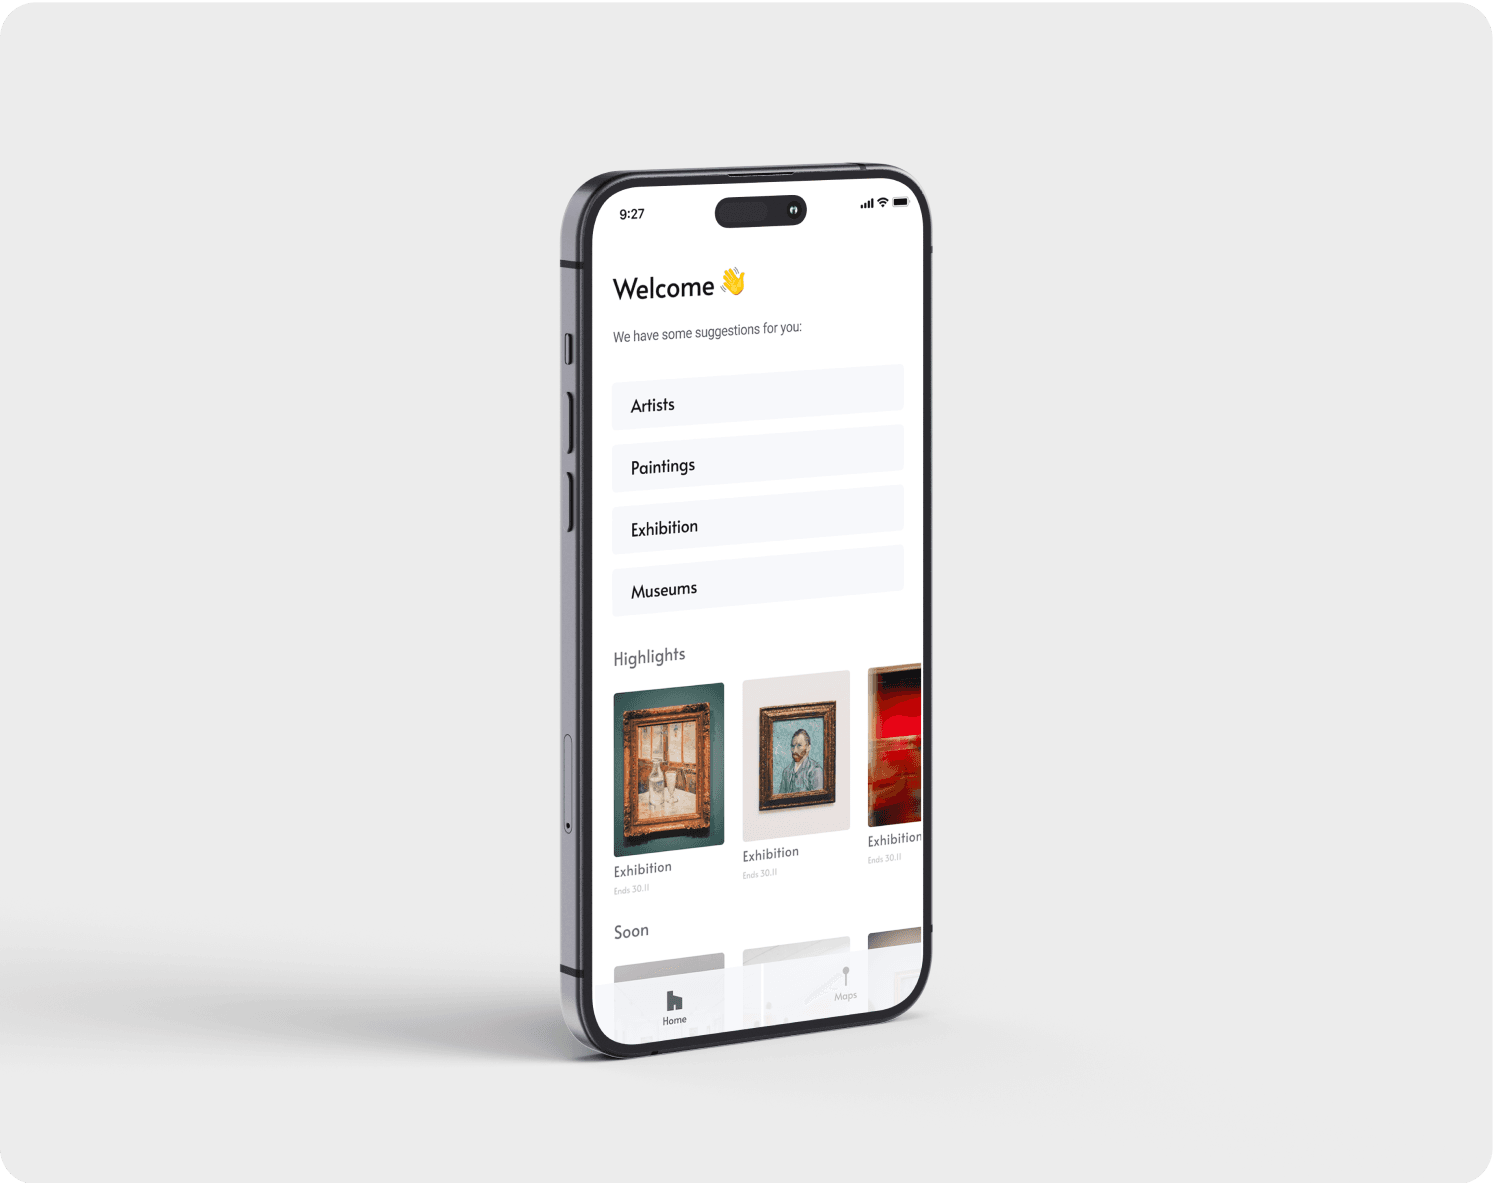
Below is a sample of the final solution accompanied by high-fidelity prototypes. If you wish to explore more visual samples, please visit my Behance.
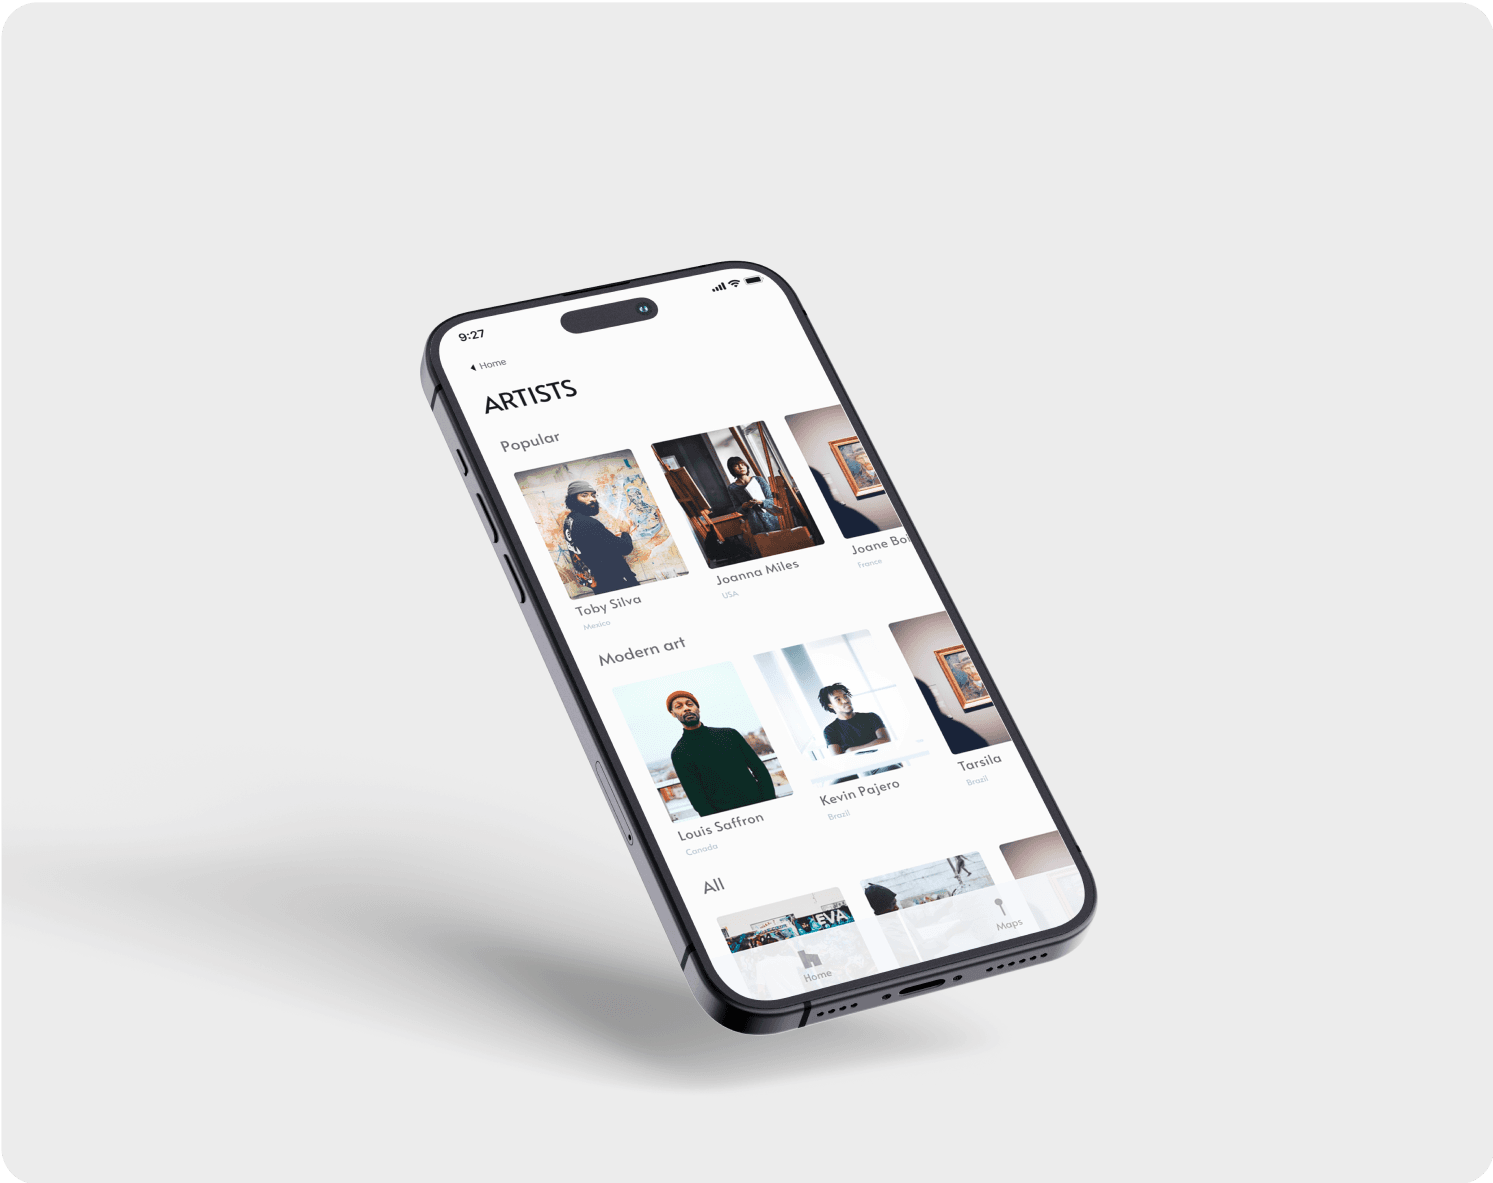
Iteration Process & Learnings
Lygia was my first case study and every now and then I revisit it to see if I need to make any changes. So I think it's important to share the old high-fidelity prototypes I made. The first, done in 2021. The last one previously presented was made in 2023.
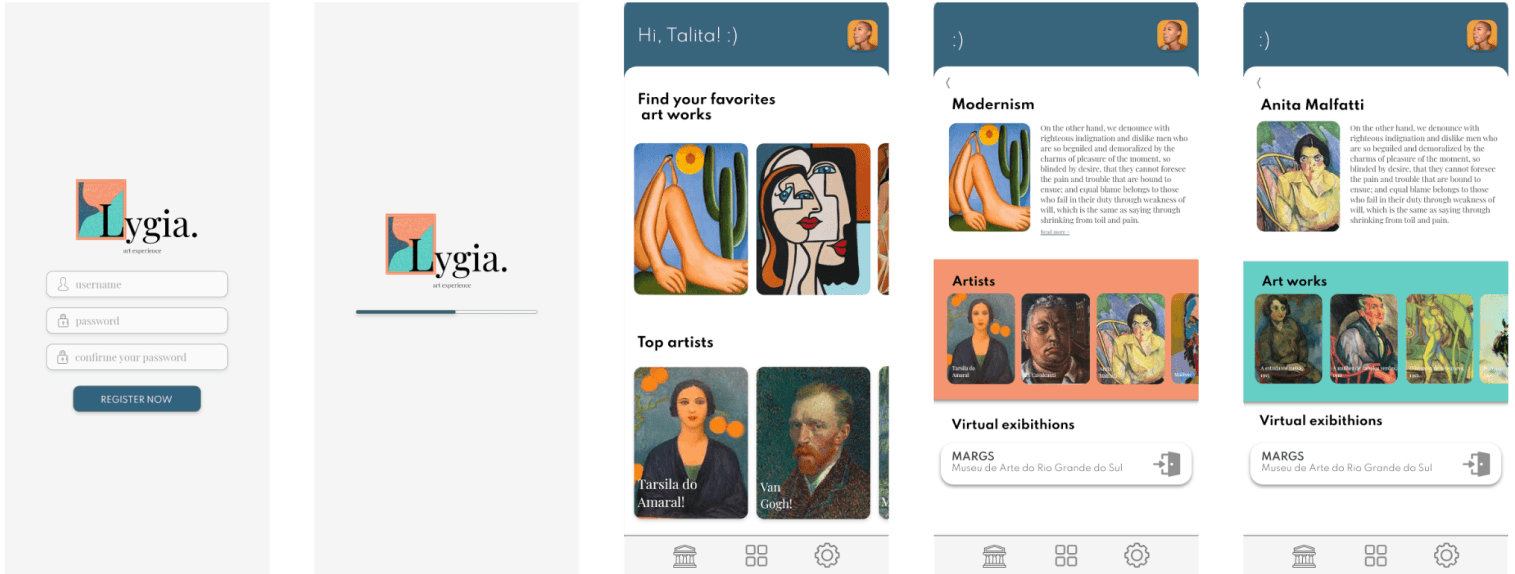
It's difficult to measure my own evolution in any activity, but I can say that I've improved a lot in technical terms of UI, visual hierarchy, information architecture, gestalt, accessibility, usability, affordances and trusting less in my biases and more in user research.

Acknowledgments and Appreciation
I extend my heartfelt gratitude to my mentor and friend Hannane Cherifi for the unwavering support and invaluable insights. I am truly grateful. 💜
How about visiting my other case study with a solved problem?
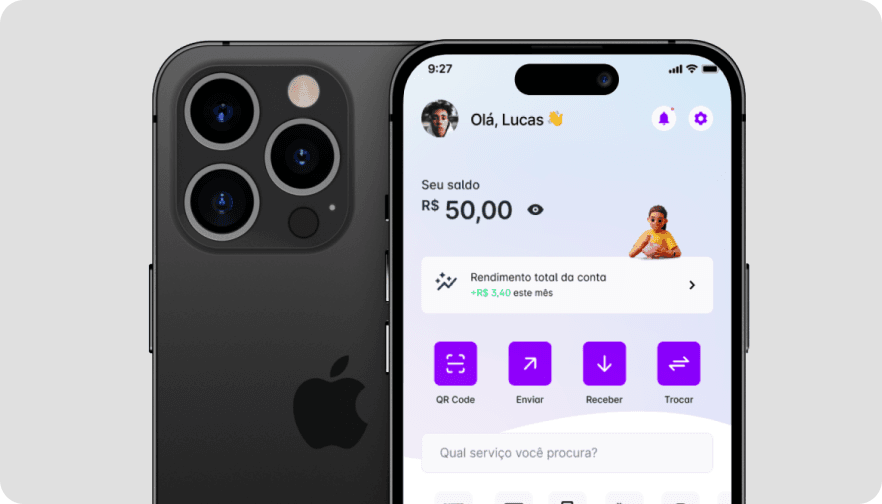
Lovepay App: Connecting People Through Payments - A Journey From My Internship
Lovepay App is a finance app created to facilitate digital payments between Brazil, Cape Verde and Portugal. Mainly focused on social interaction and independent payments for p2p and international payments.
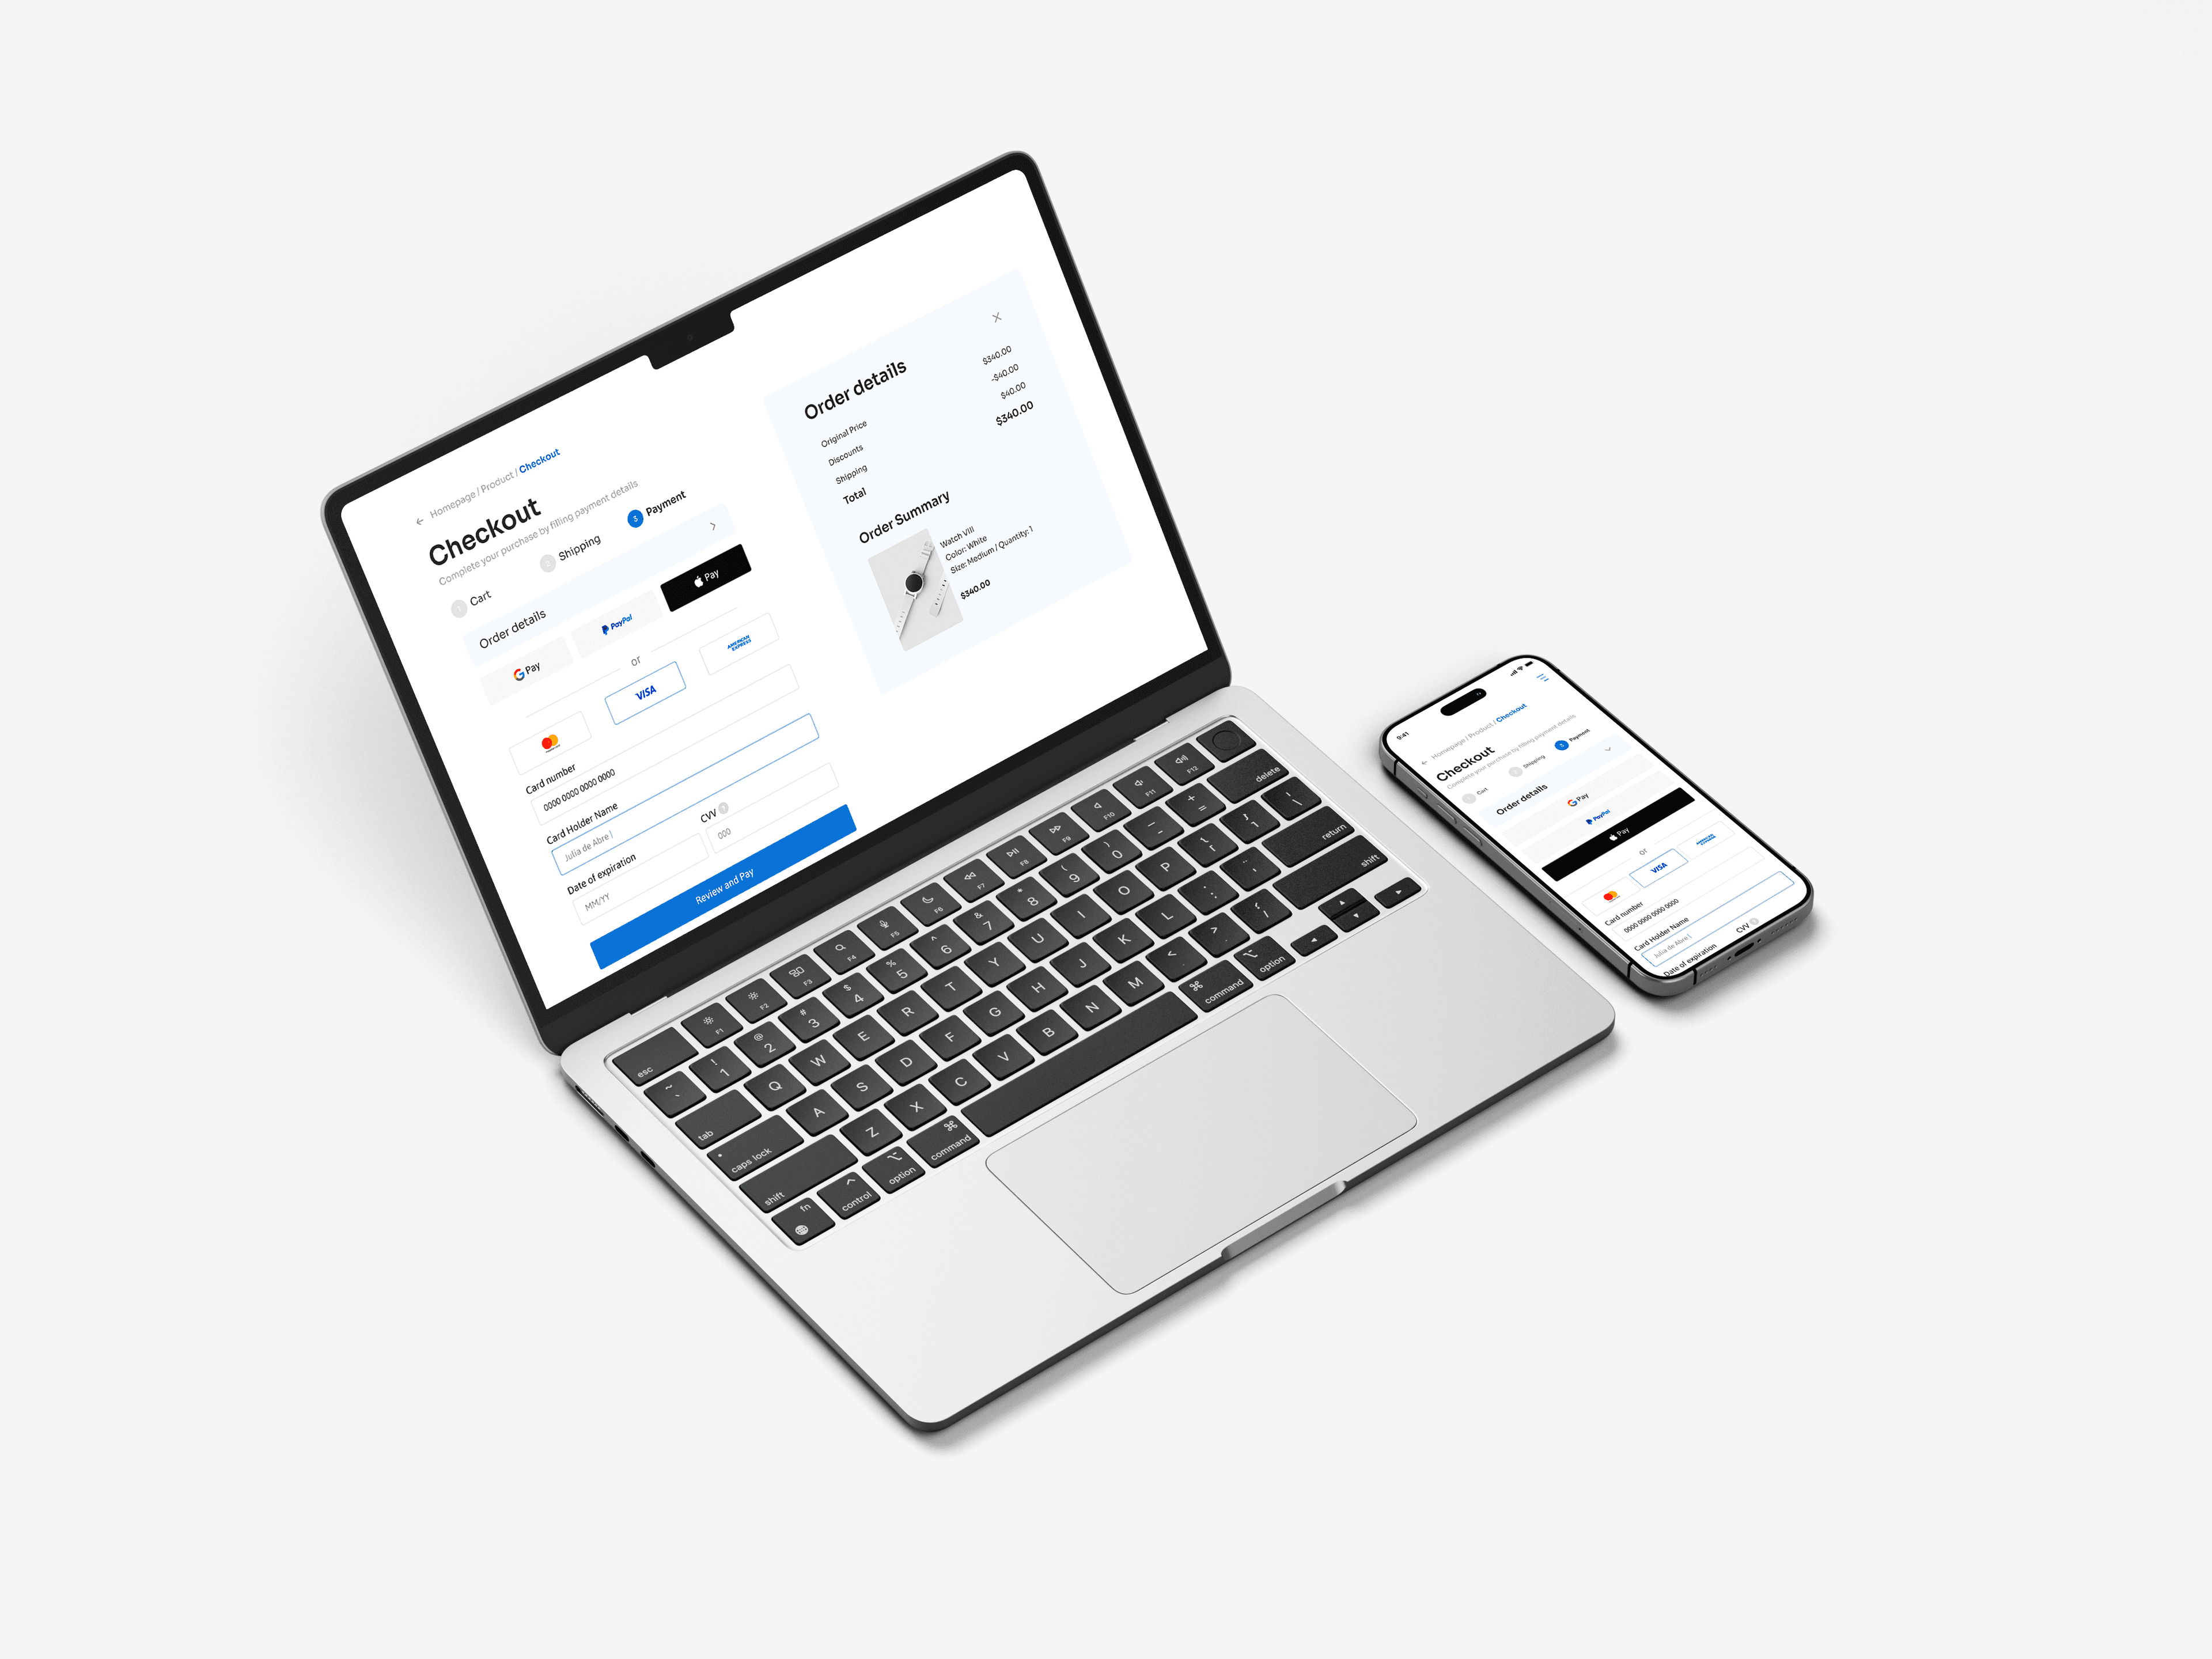
Design Playground: Daily UI Adventures
Follow along as I practice my design skills with the #DailyUI challenge, exploring new ideas and improving my creativity every day.